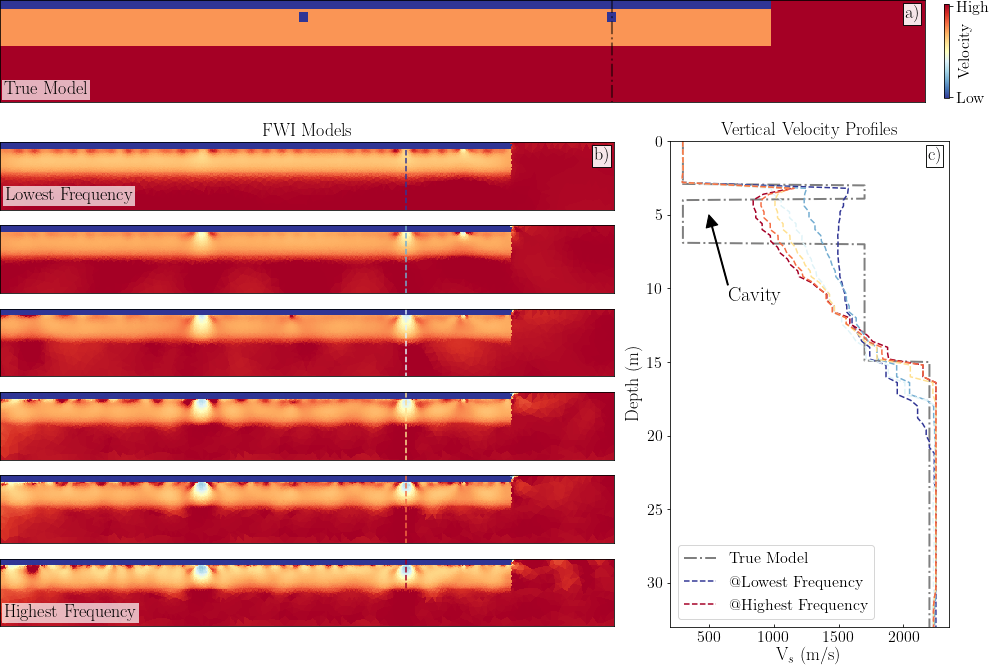
Figure 1: illustration of FWI results on the synthetic time dataset. a) shows the true shear-wave velocity model; b) displays 6 of the FWI models corresponding to 6 of the frequency groups, from the lowest to the highest; c) highlights the evolution of one vertical shear-wave velocity profile as the frequency increases.
Suitable strategies must be established before performing Full Waveform Inversion (FWI) on real data. Within the joint work between INRIA and Realtimeseismic, we generated a synthetic dataset along with a geophysical toy model featuring 2 layers, 2 cavities and a vertical wall on a substratum. We used this dataset as the input of the FWI (in frequency) tool developed by F. Faucher (Univ. Vienna) and searched for an inversion strategy that can take advantage of the surface waves among the full waveforms.
Given the special characteristics of surface waves, especially the late and dispersive arrivals compared to the body waves, we need to increase the sampling rate of the datasets in frequency to correctly make use of the surface waves. This appears to be different from a classical multi-scale FWI strategy (privileging body waves) where a few frequency samples can be sufficient for a meaningful FWI.
In general, the later the useful time signal arrives, the smaller the frequency step should be. We consider frequency groups instead of single frequencies for both efficiency and robustness concerns.
Figure 1 illustrates the FWI results on the synthetic dataset. We started from a partially smoothened initial model without the cavities and ran the FWI along a considerable number of frequency groups. The cavities can be clearly distinguished in Figure 1b) at higher frequencies. Figure 1c) highlights the vertical velocity profiles across one of the cavities (see dashed lines in Figure 1a and 1b). Both the reconstructions of the shear-wave velocity at the cavity and the horizontal interface at 15 m deep are improving as the frequency increases.


